The Three Problems After the Oven
India's biscuit sector is large and still growing — industry market-research estimates put its 2024 value at roughly USD 5 billion, with cited CAGR figures ranging from the high single digits to around 10% depending on forecast window and whether cookies and crackers are bundled into the category. That growth runs through post-oven conveyors that split cooling product across 2–3 packaging lanes via comb dividers — a stage where three problems typically go unmeasured: existing lane sensors count throughput without assessing biscuit condition; photoelectric beam sensors can meaningfully undercount once biscuits touch or shingle off the cooling belt, with the exact rate depending on line speed and product spacing; and a worn or misaligned comb divider can leave one lane running lighter than the others for a full shift with no per-lane count in place to catch it.
| Method | Limitation | Operational Impact |
|---|---|---|
| Photoelectric Beam Sensor (per lane) | Counts axis-crossings only; touching or shingled biscuits can register as a single event | Undercounting during shingling, at a rate that depends on line speed and spacing; no defect data; one sensor required per lane |
| Weight-Based Batch Check | Weighs the packed batch under net-content rules such as NIST Handbook 133 (US) or the EU Measuring Instruments Directive — not per-lane, not per-biscuit | Confirms only that total batch weight sits within legal tolerance; cannot identify which lane, biscuit, or oven zone a shortfall came from |
| Manual Visual Spot-Check | Operator samples a fraction of output; accuracy is documented to degrade with fatigue over a shift | Quality-control literature commonly cites manual visual-inspection error rates in the 20–30% range; no lane-balance monitoring possible |
| End-of-Line Checkweigher | Verifies per-pack weight; cannot see individual biscuit condition inside a sealed pack | A broken piece within weight tolerance still passes; a short-pack near the tolerance edge can also pass |
| Single-Lane Vision System | One camera per lane; independent systems cannot compare counts across lanes | Hardware cost scales per lane; no unified cross-lane balance view |
Why Traditional Methods Fall Short
Manual spot-checking sits on the same weak footing documented across manufacturing quality literature generally: widely-cited Sandia National Labs research found even experienced inspectors catch only around 80% of defects at peak performance, with accuracy declining further as fatigue sets in over a shift — and researchers caution against treating any single figure as a universal benchmark across industries. What is consistently reproducible is the structural gap: an operator sampling a handful of biscuits per hundred cannot deliver a systematic, per-lane, per-shift record, and a photoelectric sensor counting axis-crossings has no way to tell a whole biscuit from a broken one, or a well-fed lane from a starved one.
- A beam sensor registers a crossing event, not a biscuit — it cannot distinguish one biscuit from two touching biscuits, and it carries no shape, size, or colour information.
- Manual sampling rates are necessarily a small fraction of total output, so a broken-piece or colour-drift problem can run for an entire shift before a spot-check happens to catch it.
- None of the sensor-based methods compare lane to lane in real time, so a slowly worsening comb-divider fault is typically only visible in hindsight, at end-of-shift yield reconciliation.
- Every added lane sensor is another point of maintenance, calibration, and PLC wiring — cost that scales linearly with lane count rather than being absorbed by one shared system.
AI Video Analytics — One Camera, Three Outputs
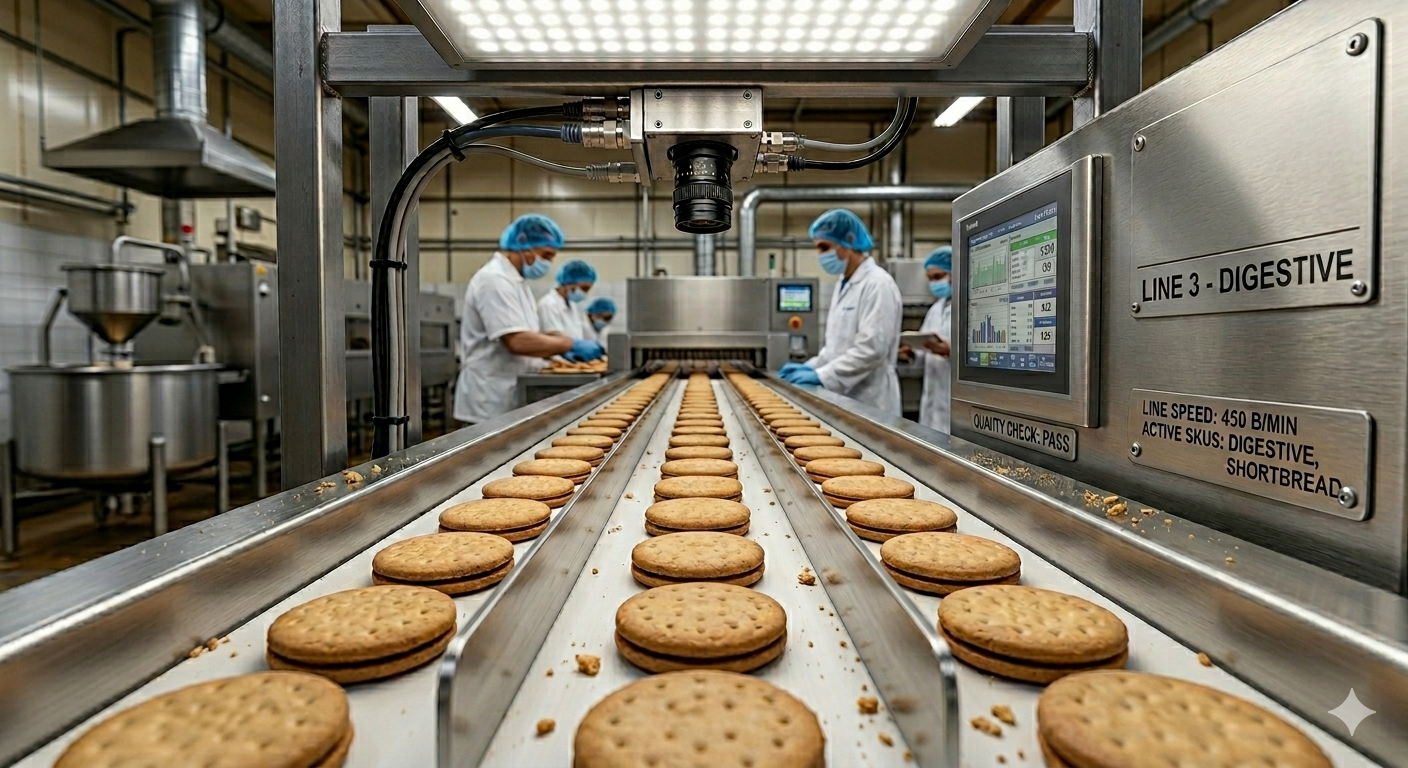
Qualitas mounts a single GigE area-scan camera with a wide-field-of-view lens above the post-oven multi-lane conveyor, positioned to cover all 2–3 lanes in one frame, with a full-width diffuse LED bar to control shadows and specular hot-spots off glazed or sugar-dusted biscuit surfaces. Camera resolution and mounting height are sized during commissioning against the actual biscuit diameter and the pixel density needed to resolve the customer's defect list — the same first-principles calculation used across Qualitas's counting and inspection deployments, rather than a fixed spec set in advance of seeing the line.
An instance-segmentation model processes each frame and outputs a separate mask per biscuit, rather than a single blob per touching cluster — this is the specific capability that a beam sensor lacks, and it's what makes shingled or overlapping biscuits countable instead of an undercount. Published academic benchmarks for instance segmentation on touching or overlapping objects report accuracy in roughly the 85–99% range depending on object density, image quality, and how tightly instances overlap; where a given line lands within that range depends on its own product, lighting, and camera geometry, and gets established during on-site validation rather than assumed from a lab benchmark. Three outputs are derived from the same model per frame: a per-lane count event when a tracked biscuit centroid crosses a virtual count line, a condition classification (for example whole, broken, deformed, or a colour/shade outlier), and a running per-lane count used to compute a lane-balance comparison.
| Detection Scenario | Technical Approach | What It Targets |
|---|---|---|
| Multi-lane count (2–3 lanes) | Single wide-FOV camera; per-lane virtual count lines with centroid tracking | Count accuracy at or above what individual per-lane beam sensors already achieve on well-separated product — validated per line during commissioning |
| Touching / shingled biscuits | Instance segmentation separates overlapping masks instead of treating a cluster as one object | Directly addresses the failure mode that causes beam-sensor undercounts during shingling |
| Broken biscuit detection | Segmented area compared against the median whole-biscuit area for that product and shift | Flags fragments below a configurable area threshold, tuned per biscuit shape and size |
| Deformed / misshapen biscuit | Shape descriptors (circularity, aspect ratio) compared against a learned reference range | Flags shapes outside the expected envelope for that SKU |
| Colour / shade anomaly | Per-instance colour comparison against a rolling shift baseline | Surfaces gradual drift, such as over-baking, before a spot-check would catch it |
| Lane imbalance / comb fault | Per-lane count tracked continuously and compared against the other lanes | Replaces end-of-shift reconciliation with a running comparison, surfacing a widening gap well before a shift ends |
Expected Outcomes & Return on Investment
| Outcome Area | Sensor + Manual Baseline | With Instance-Segmentation Vision |
|---|---|---|
| Count accuracy | Reliable on well-separated product; beam sensors are prone to undercounting once biscuits touch or shingle | Designed to hold accuracy through shingling by segmenting individual biscuits rather than counting axis-crossings; exact figure confirmed per line |
| Broken-biscuit catch rate | Manual spot-checks sample a small fraction of output per shift | Every biscuit in frame is evaluated, not a sampled subset |
| Lane-imbalance detection | Typically only visible at end-of-shift yield reconciliation | Tracked continuously per lane, surfacing a developing imbalance well before a shift ends |
| Hardware per 3-lane line | A sensor, mount, and PLC input per lane | One camera, one lighting bar, and one processing unit covering all lanes |
| Colour/shade drift detection | Reactive — depends on a spot-check happening to catch it | Compared continuously against a rolling shift baseline |
| Trend data | Little to no systematic record of broken-rate history | Per-shift data logged, and cross-referenceable against oven-zone records where those exist |
Payback period depends heavily on a line's current sensor and labour cost baseline, product value, and volume — it should be modelled against the customer's own numbers during the feasibility assessment rather than assumed from a generic industry figure.
Implementation Considerations
A typical rollout runs in phases rather than a single cutover: an initial phase deploys on the highest-volume lane configuration with counting and broken-biscuit detection active, establishing a measured baseline broken rate per shift; a second phase adds colour/shade-anomaly detection and any ERP/MES integration needed for batch-level count and yield reporting; a third phase extends the same architecture to additional lines. Exact phase durations depend on integration scope and are confirmed during the feasibility review rather than fixed in advance.