The Label Print Inspection Challenge
Industry research from Reports and Data sizes the label print quality inspection equipment market at roughly USD 1.2 billion in 2024, projected to grow at close to a 7.5% CAGR through 2034 — a reasonable proxy for how fast label and packaging lines are moving off manual sampling. Flexographic label presses commonly run in the 120–250 m/min range in production, with some lines faster still, well beyond the rate at which a person can read every printed character. A single defective label that reaches a retailer or, worse, a patient carries consequences ranging from a chargeback to a regulatory recall, and the cost of a miss compounds with run length.
| Risk Factor | Business Impact | Why a single figure is misleading |
|---|---|---|
| Mislabelled pharmaceutical product | Recall exposure under FDA/DSCSA or India's CDSCO rules | Recall scope depends on lot size, distribution reach, and the regulator involved — not a fixed percentage. |
| Unreadable or low-grade barcode | Retailer chargeback or shipment rejection at the dock | Cost varies by retailer contract and volume; GS1 sets a print-quality floor (Grade C / 1.5 under ISO/IEC 15416), not a rupee figure. |
| Brand colour deviation | Rework and brand-equity risk | Colour difference becomes perceptible to an attentive observer above roughly ΔE 2.0; the acceptable tolerance is set by the brand, not a universal constant. |
| Wrong or transposed expiry/batch text | Consumer-safety hazard, possible mandatory withdrawal | Severity is safety-driven and case-specific, not proportional to press speed. |
| Cosmetic defects (smear, pinhole, void) | Shelf-appearance failure, customer complaints | No ISO standard grades cosmetic print defects; acceptance thresholds are set per brand or customer spec. |
| Missing serialisation code | Track-and-trace compliance failure | Enforced under GS1, DSCSA, and FSSAI frameworks, with escalating audit and penalty exposure rather than one number. |
Why Traditional Inspection Falls Short
The weakness isn't a single fixed accuracy ceiling. Published Sandia National Labs research on precision-manufactured parts found individual inspectors caught roughly 80% of defects at their best, with two inspectors independently checking the same parts catching a combined 96% — and the human-factors literature more broadly cites a commonly-used benchmark of around 70% probability of detection for repetitive visual inspection tasks. Both figures come with the same caveat: they describe specific studies, not a universal ceiling for any given label line. What is well established is the direction of the effect — fatigue measurably degrades inspection performance within the first 20–30 minutes of a repetitive visual task, and sampling-based inspection by definition never looks at most of what ships.
- Colour judgement is subjective without instrumented ΔE measurement, so brand guidelines get enforced inconsistently shift to shift.
- Sampling a fraction of labels leaves the rest unchecked — a run that drifts mid-roll can still ship.
- Reading every printed character against a live database is impractical by eye at press speed, so wrong dates and batch codes can pass.
- Barcode grading has traditionally been a post-print lab check rather than an inline gate, so a bad roll is only caught after it is already produced.
- Paper-based QC logs make it hard to see defect trends across shifts, presses, or SKUs.
The Machine Vision Approach
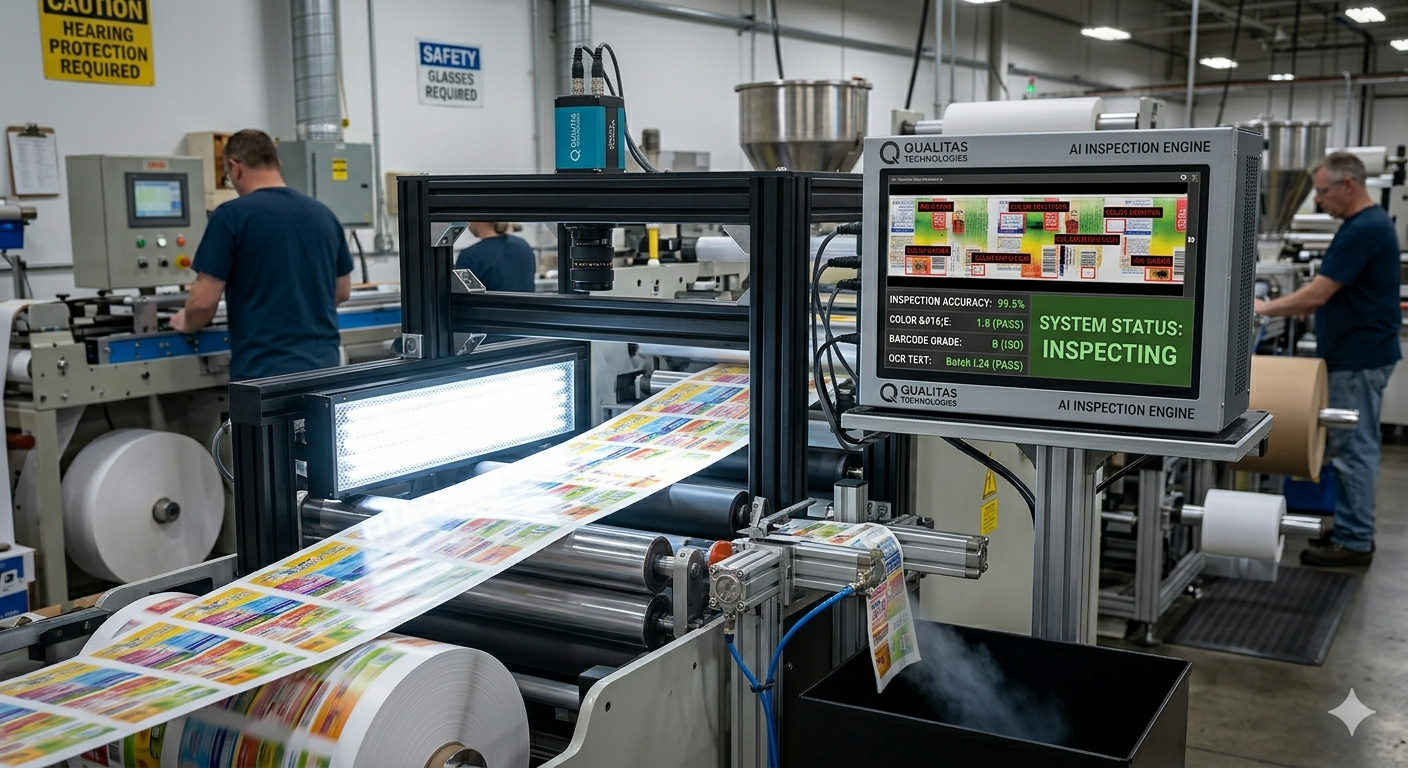
Station 1 — Image Capture: A colour line-scan camera, encoder-triggered to web speed, captures the full label width continuously rather than in discrete frames. Camera resolution and line rate are sized to the press speed and the smallest character or defect that must be resolved, typically landing in the 300–600 dpi-equivalent class for label content. Diffuse strobe illumination is tuned to hold colour consistency across CMYK, spot-colour, and varnished labels.
Station 2 — AI Inspection Engine: Rule-based algorithms handle deterministic checks — presence, alignment, blob and edge defects — while a deep-learning model trained on the customer's own good and defective samples catches the variation a fixed rule can't anticipate. OCR reads variable text fields; OCV compares the read result against the expected template or a live database record. Colorimetric measurement (typically CIE ΔE2000) flags colour drift against a reference, with ΔE ≤ 2.0 a common packaging tolerance — though the working threshold should always be set against the brand's own guideline rather than assumed. Barcode and 2D-code grading follows the ISO/IEC 15416 (linear symbols) and ISO/IEC 15415 (2D symbols) test methods, with GS1 setting a supply-chain floor of Grade C (1.5).
| Defect Type | Detection Method | Governing Standard / Reference |
|---|---|---|
| Ink smear, smudge, voids | Blob and edge-based image analysis against a golden reference | No universal ISO standard covers cosmetic print defects; threshold is set per customer spec. |
| Missing or faded print | OCR plus contrast/density check | Per customer print-quality spec. |
| Barcode / 2D code readability | ISO decode simulation and grading | ISO/IEC 15416 (linear), ISO/IEC 15415 (2D); GS1 minimum Grade C / 1.5. |
| Colour deviation | CIE ΔE2000 colorimetric comparison to a reference | Benchmarked against the brand's own colour guideline; ΔE ≤ 2.0 is a common packaging tolerance. |
| Wrong or transposed text | OCV string comparison against template or database | Per GMP / FSSAI / customer labelling spec. |
| Label misalignment or skew | Pattern matching and angular-offset measurement | Tolerance set by the mechanical/label-application spec, not a print-quality ISO standard. |
| Missing serialisation code | Presence detection plus OCV | GS1 / DSCSA / national track-and-trace mandate. |
Expected Outcomes & Return on Investment
The figures below mix external, cited research with one real deployment figure from Qualitas' own OCR work — they are a starting point for a business case, not a guarantee for any specific line. Actual detection rates, coverage, and payback should be validated against the customer's own defect library and cost data during commissioning.
| Outcome Metric | Typical Manual Baseline | With Inline Machine Vision | Basis |
|---|---|---|---|
| Defect detection rate | Commonly cited around 70% probability of detection for repetitive manual inspection | High-90s%, verified per SKU during commissioning | Human-factors literature for the baseline; the automated figure is site-specific and should be validated, not assumed. |
| Barcode first-pass scan rate | Degrades when print quality isn't graded before shipment | >99% achievable when a Grade C / 1.5 floor is enforced inline | Consistent with GS1's own barcode-quality guidance. |
| OCR/OCV accuracy on variable text | Not practically measurable by eye at press speed | 99.14% date-code / 95.66% serial-number accuracy achieved in one Qualitas FMCG deployment | Qualitas OCR case study — a real deployment result, not a universal guarantee for every substrate and print quality. |
| Inspection coverage | Sample-based; typically a fraction of output | 100% of labels inspected | Structural benefit of inline, encoder-triggered capture. |
| Payback period | — | Often discussed in a 12–24 month range for comparable inline QC deployments | Indicative only — depends on scrap cost, chargeback exposure, and labour reallocation at the specific site. |
Implementation Considerations
A representative set of approved "golden" label samples per SKU — typically a few dozen — supports template creation and colour profiling; deep-learning defect models improve with a broader set of known-defect images per class, built up from real production samples rather than staged ones. Each new label SKU needs a template-creation step; the exact time depends on label complexity and how many variable fields it carries.