The Cashew Kernel Grading Challenge
Market-research estimates of the global cashew market vary by methodology and scope — figures for 2025 range from roughly USD 8.0Bn (IMARC Group) to USD 9.9Bn (Mordor Intelligence), with Mordor projecting growth to USD 14.64Bn by 2031 at a 6.74% CAGR. India and Vietnam together process an estimated 80% of the world's cashews, with India alone accounting for roughly 36.5% of global processing volume (International Nut and Dried Fruit Council, 2024). India's share of finished-kernel exports is considerably smaller than its processing share, since a large share of processed volume is consumed domestically or re-exported by other markets — a distinction worth keeping straight when sizing an opportunity.
Kernels are graded on colour, size, and wholeness under the AFI (Association of Food Industries) standard used across international trade, which sets roughly two dozen recognised grade codes — from large whole grades like W180 (around 170–180 whole kernels per pound) down through mid-tier grades such as W320 to small pieces and splits. Premium whole grades command a real, but variable, price premium over mid-tier grades — buyers and trade commentary describe this broadly in the 15–30% range depending on season, origin, and buyer, so treat any single percentage as indicative rather than a fixed differential.
| Failure Mode | Downstream Consequence | Commercial/Regulatory Risk |
|---|---|---|
| Grade misclassification | Price realized below true value | Revenue loss per lot; buyer disputes |
| Black spot/mould accepted | Food safety rejection at port | EU/FDA non-compliance; lot destruction |
| Shell fragments in pack | Consumer injury risk; recall event | FSSAI/APEDA withdrawal; brand damage |
| Scorched mixed into white grade | Colour downgrade of entire lot | Retailer penalty; re-sort cost |
| Shrivelled kernels passed | Texture/taste failure in product | Customer return; contract cancellation |
Why Manual Grading Falls Short
Cashew grading and sorting remains a heavily manual, labour-intensive step in most processing plants — work that sector studies describe as employing a predominantly female workforce (estimates for parts of India's processing belt run as high as 90%+) doing repetitive, close-attention sorting for long shifts. Industry commentary consistently cites a shortage of experienced graders as a structural constraint on capacity, not simply a cost line. Published and industry-reported figures for manual sorting accuracy cluster loosely around 90–95% for a trained crew working at a controlled pace; the more defensible argument for automation isn't a precise accuracy delta but consistency — a vision system applies the same grade boundary to kernel #1 and kernel #100,000 on a shift, which a fatigued human crew cannot guarantee.
| Manual Method | Capability Limitation | Operational Impact |
|---|---|---|
| Visual colour grading | Subjective; reference-card dependent | White/Scorched/Desert boundaries drift between operators and shifts |
| Hand sorting (whole vs split) | Throughput capped by crew size and fatigue | Cannot sustain full-line-speed, 100% inspection |
| Manual defect inspection | Attention degrades over a long shift | Defect miss rate is widely reported to rise later in a shift, though the exact magnitude is plant-specific |
| Mechanical sieve grading | Size-only; no colour or defect detection | Scorched/black-spot kernels pass through untouched |
| Sample-based QC checks | Lot-level, not kernel-level, confidence | A bad cluster within an otherwise-good lot can go undetected |
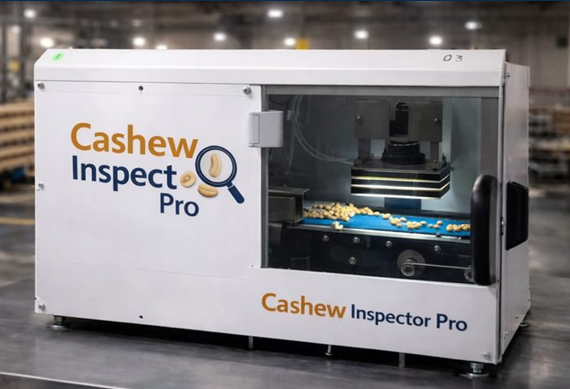
Three-Station Machine Vision Approach
Station 01 (Morphometric Sort) uses diffuse white LED dome imaging with area-scan cameras capturing top and side views. Algorithms extract length, width, area, perimeter, aspect ratio, and convexity to classify kernels as Whole, Split, Butt, or Piece within AFI size brackets. Published cashew-grading studies using these features with classical classifiers (backpropagation neural networks, SVMs, and similar) report accuracy in the mid-to-high 90s percent range for shape and size-bracket classification — the figure that actually matters is the one measured on the processor's own kernel variety during feasibility, since results are known to vary with cultivar and camera setup.
Station 02 (Multi-Channel Colour Grading) combines white LED and UV illumination to discriminate White, Scorched, and Desert colour grades and to flag areas of fluorescence associated with mould growth. UV/fluorescence-based aflatoxin screening is an active research area — published work on nut fluorescence imaging (evaluated on almonds) reports classification accuracy up to roughly 90% for flagging suspect kernels — but it functions as a risk-screening layer to route suspect lots for testing, not a replacement for certified aflatoxin assay methods.
Station 03 (Deep Learning Grading & Traceability) applies a trained classification model per kernel. In one peer-reviewed comparison, a YOLOv5-based classifier reached 97.65% accuracy across five categories (whole/broken/split-up/split-down/defect) with 0.025-second inference time, ahead of a comparable CNN (97.62%) and YOLOv9 (82%) evaluated on the same dataset. A separate published low-cost system built on a Raspberry Pi with YOLOv5s, evaluated on three commercial grades (W180/W300/W500), reported over 93% classification accuracy with 94–96% physical sorting accuracy on a conveyor. These are results from specific studies on specific datasets, not a guaranteed figure for any given facility — the training set built during feasibility on the processor's own kernels is what determines real-world accuracy.
| Defect/Attribute | Sensing Modality | Indicative Accuracy Range (published research) |
|---|---|---|
| Whole vs Split/Butt/Piece | RGB morphometric | Mid-to-high 90s% |
| AFI size-bracket sorting (e.g. W180→W450) | RGB area-scan | Mid-to-high 90s% |
| Black spots/mould stain | RGB + UV fluorescence | High 80s–90s%, screening-grade |
| White/Scorched/Desert grade | RGB colour classification | Mid-to-high 90s% |
| Shell/husk fragments | RGB texture + shape | High 90s%, hardware-dependent |
| Aflatoxin risk flag (UV screen) | UV fluorescence | Screening indicator only — not a certified assay |
These ranges are drawn from published research and comparable deployments, not a warranty — Qualitas validates against the processor's own lots, varieties, and lighting conditions during the feasibility phase before any figure is quoted for a specific line.
Expected Outcomes & ROI
To illustrate the order of magnitude rather than predict an outcome for any specific plant: a facility exporting several hundred metric tons of premium whole-grade kernels per month recovers real value from even a modest improvement in correctly identifying and separating those grades, since premium whole grades carry a genuine (if variable, roughly 15–30% reported) price premium over mid-tier grades. The actual monthly figure for a given plant depends on contracted grade premiums, the current baseline misclassification rate, and volume — inputs a feasibility study should establish before sizing a system, rather than a number quoted upfront. For a sense of automated throughput, a published delta-robot cashew grading system reported an average pick cycle of about 1.4 seconds per kernel with a sorting success ratio above 98.6%, with total line throughput scaled by running multiple stations or using conveyor-based rejection instead of individual picking.
| Outcome Area | What Changes | Business Driver |
|---|---|---|
| Grade classification consistency | Same grade boundary applied to every kernel, every shift, vs. operator-dependent judgement | Reduces the drift that causes buyer disputes and under-realized price |
| Inspection coverage | 100% kernel-level inspection replaces sample-based lot checks | Catches bad clusters that sample QC would miss |
| Labour allocation | Reduces headcount needed specifically at the grading/sorting step | Overall labour impact and payback period are plant-specific — model against your own labour cost and volume |
| Export rejection exposure | An added 100%-inspection layer ahead of packing | Directional reduction in defect pass-through; the specific number depends on your current baseline |
| Lot traceability | Per-kernel image + grade log retained against the lot | Supports AGMARK/FSSAI/APEDA documentation requirements |
| Aflatoxin risk screening | Continuous UV-fluorescence flag on suspect kernels | Early routing to certified testing — a screening aid, not a substitute for the assay |
Implementation Considerations
Phase 1 — Feasibility (4–8 Weeks): Representative lots spanning the processor's actual grade and variety spectrum are imaged and classified to establish a baseline detection performance specific to that plant's kernels — not a generic published figure. This phase also generates the training dataset used to tune the deep-learning models before any commitment to hardware.